Success Case · Post-ERP reporting and accountability
KPIs exist but do not change decisions
A new ERP promised visibility. Agreement on a few numbers delivered it.
Anonymized case study · Exhibits use synthetic data
The records came. The answers did not.
A European distributor of technical products replaced a legacy system, a lightweight application that had grown into the role of an ERP, with Microsoft Dynamics 365. The investment was sponsored by the CEO personally, and the reasoning was growth: the company intended to expand into neighboring European markets, and the old system could not carry that. A modern ERP records everything, so visibility was assumed to arrive with it.
The company first built a reporting layer internally. It carried errors nobody fully trusted, mixed a dozen visuals per page without hierarchy, and nowhere showed the one thing a review needs: the goal next to the achieved. Teams reverted to reports pulled straight from the ERP and to personal pivot tables, so each department arrived at the monthly review carrying its own version of the business. Sales would not agree with the figures shown, because what counts as a sale was never settled.
Nothing in this picture was a software defect. The missing layer was agreement.
What changed with the reporting layer
The monthly review stopped relitigating whose number was right
Accountable owners stand in front of figures they agreed to, and progress is demonstrated or it is not, with no version left to hide behind. Debate over figures still exists in a sales performance review, but it now takes a fourth of the session. Actions with specific customers hold the front seat, and marketing investment decisions sit a close second.
Exhibit A
The before-pattern and the after
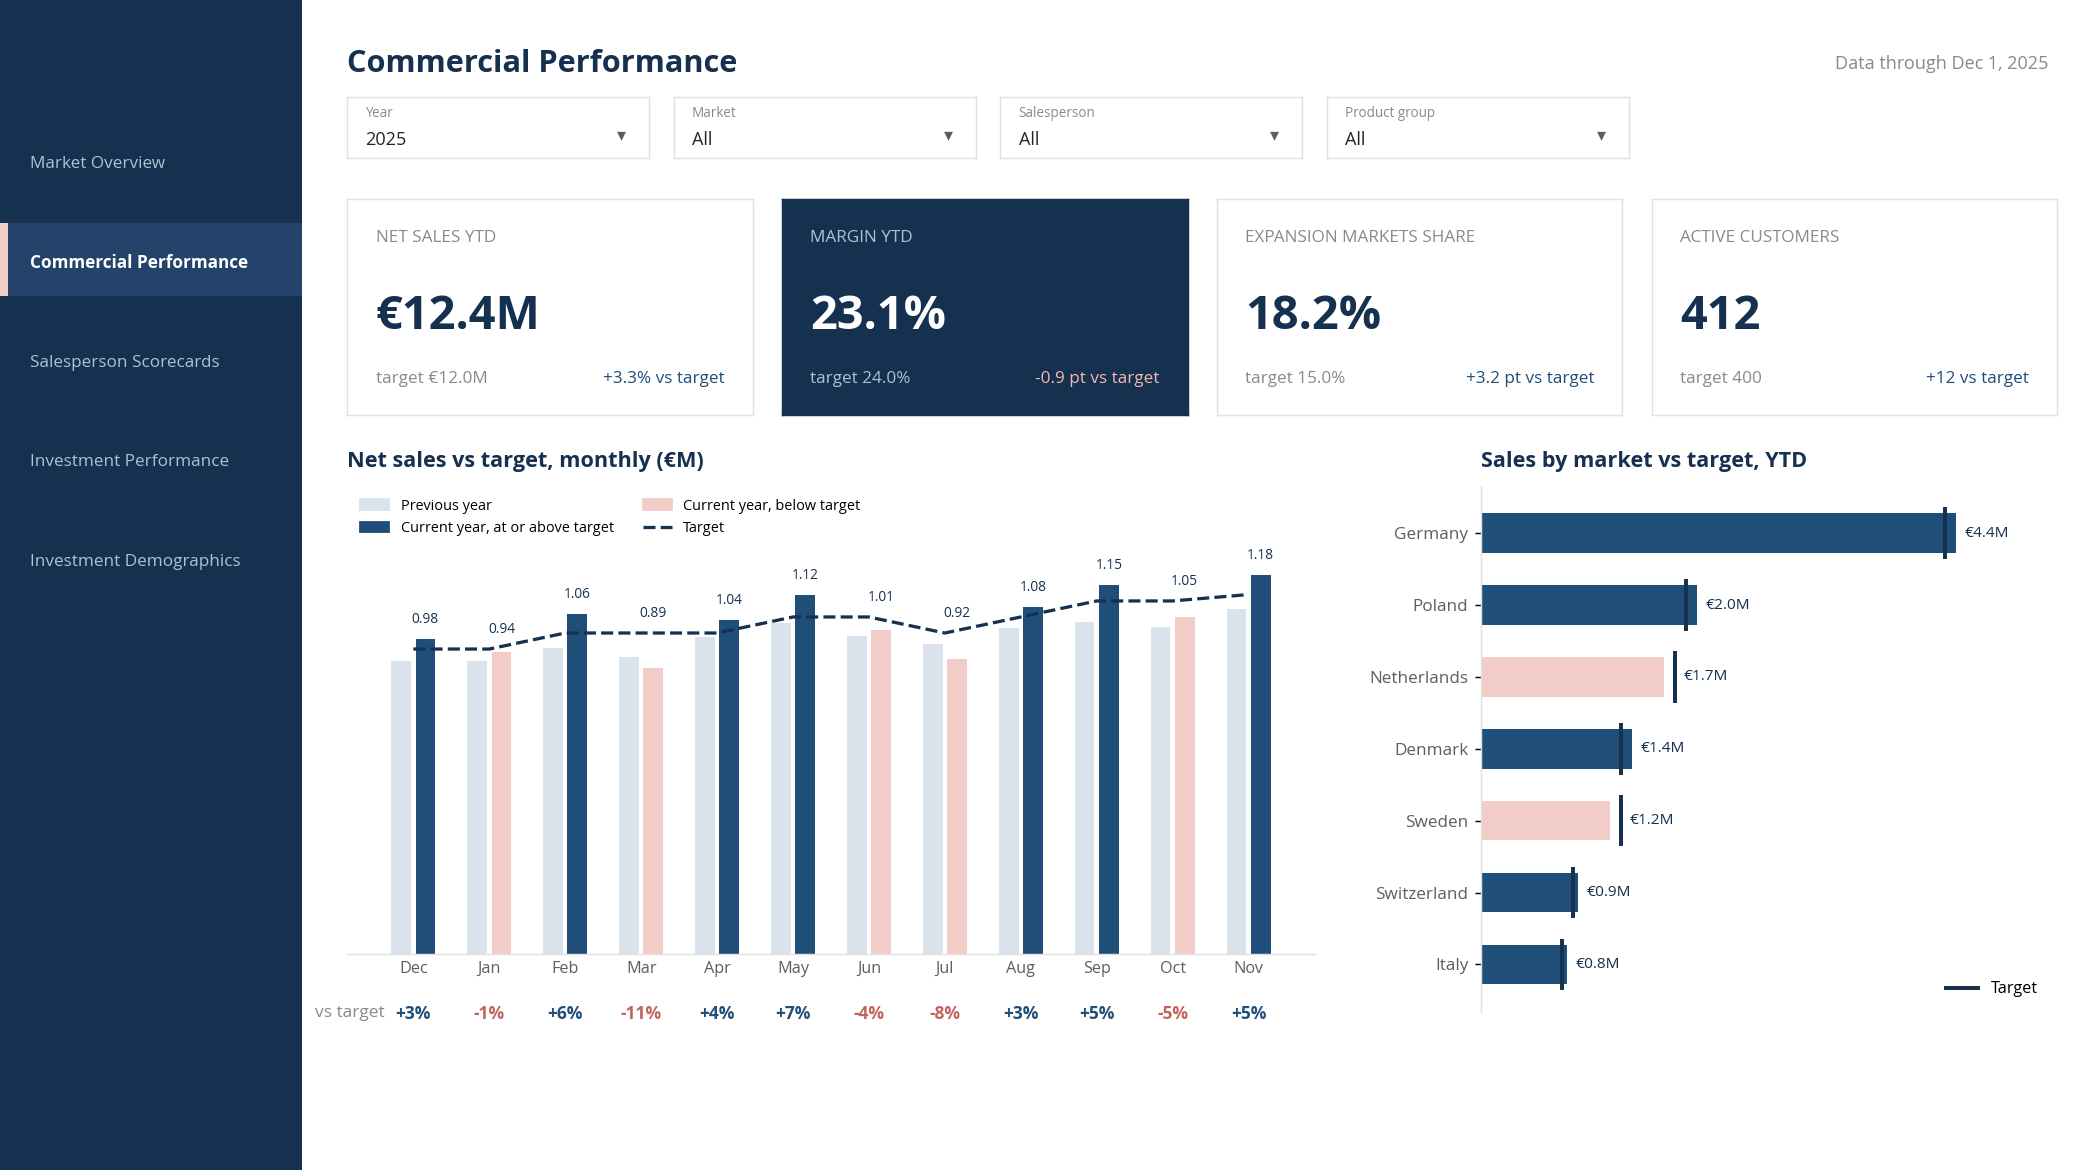
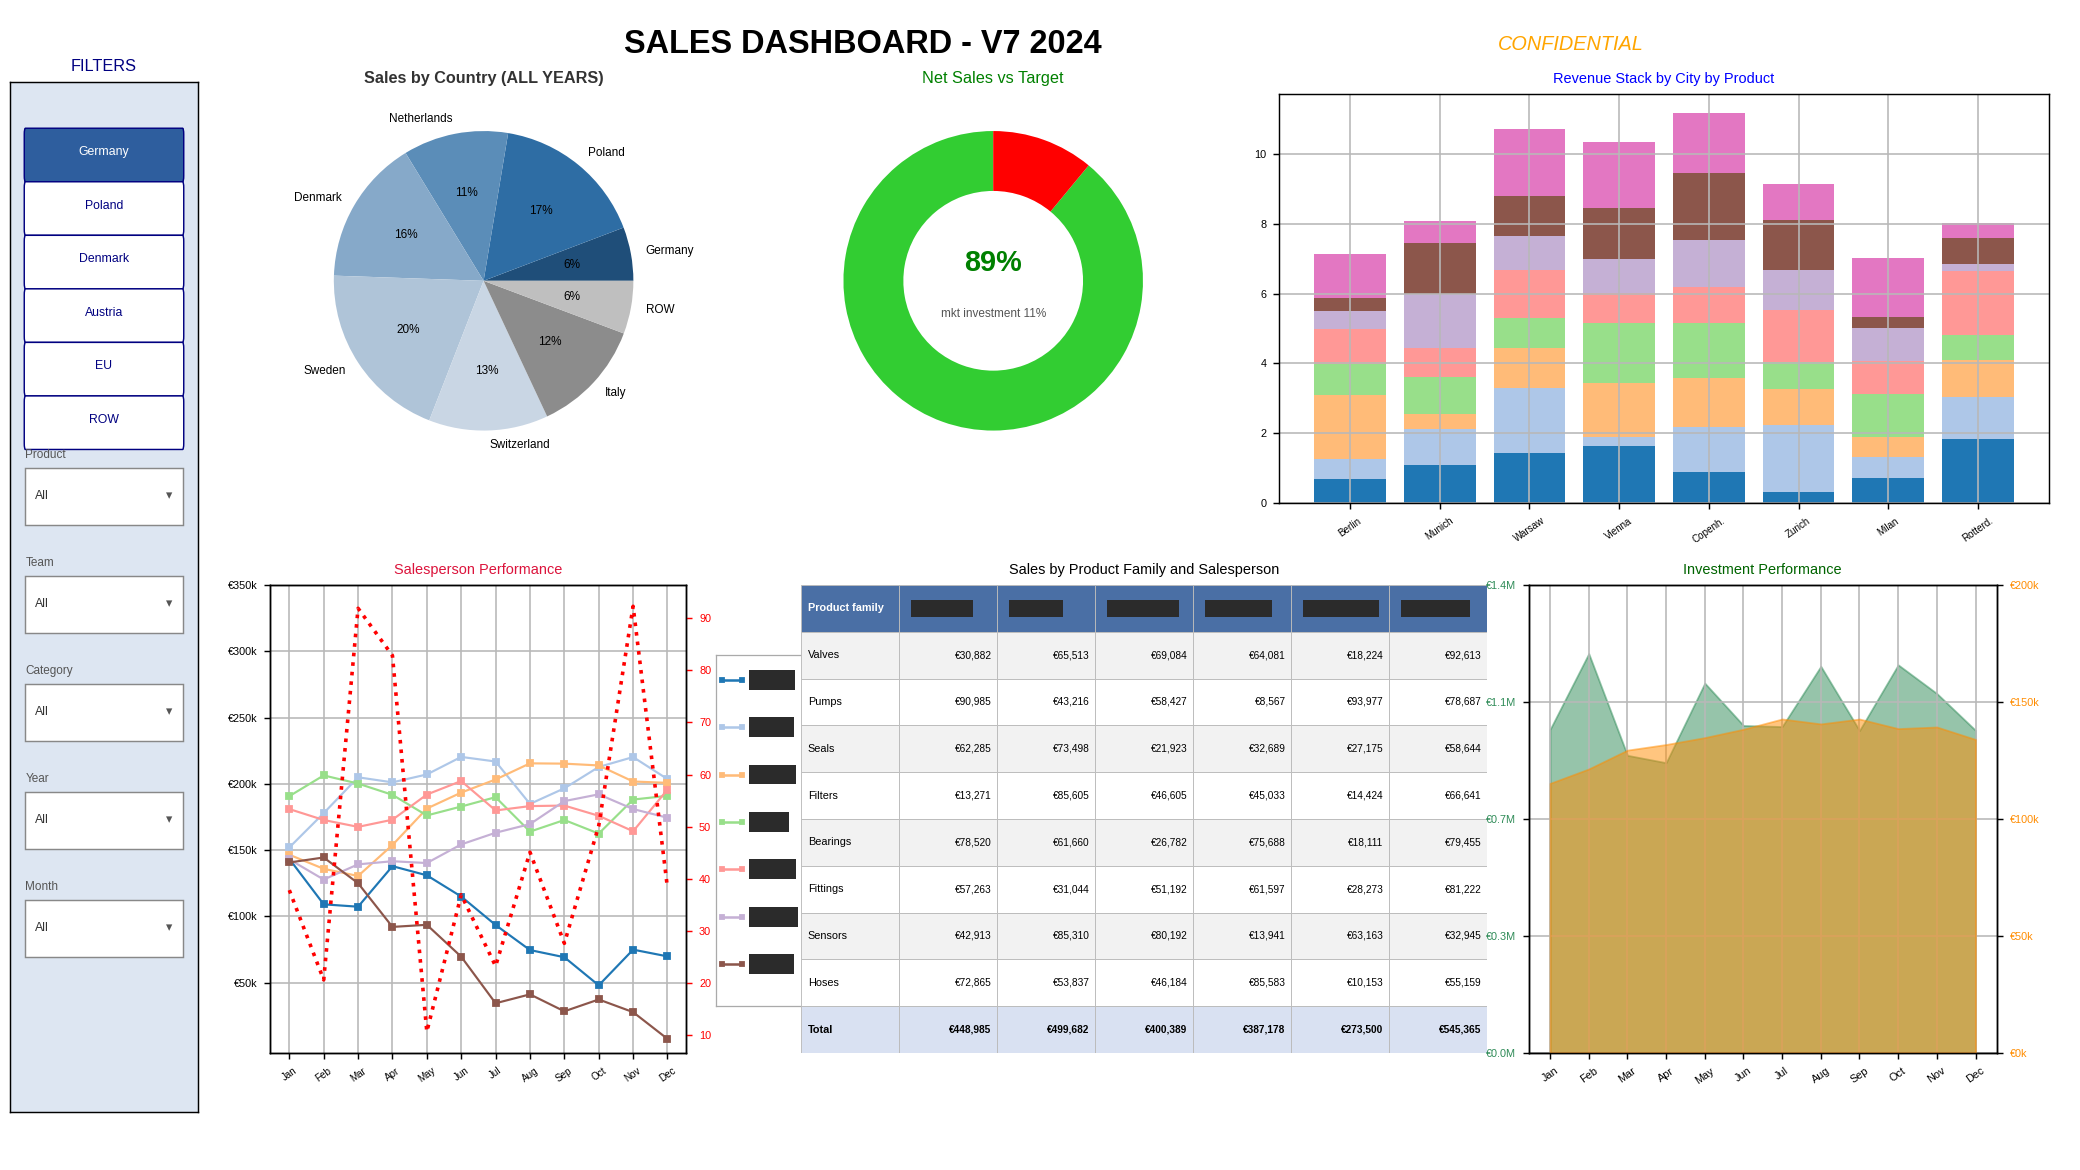
Drag the handle to compare. Reconstructed with synthetic data: from a dozen visuals and sixty numbers, mixed scales and no target anywhere except one buried gauge, to four agreed key results with targets. Every chart in the before-pattern has a noble objective; the failure is structural, not cosmetic.
Method
Agreeing what progress means
The engagement did not start with screens. It started with a Decision Diagnostic: sessions with the CEO, Sales leadership and Finance on one question, which few numbers would prove or disprove the expansion this company bought an ERP for. The outcome was a short set of key results, each with a written definition and a named owner.
01
Net sales against target
By market and by salesperson. Owned by Sales leadership, with one target line per market.
02
Margin against target
By market. Owned by Finance, so the growth push cannot quietly buy revenue with discount.
03
Revenue share of expansion markets
Owned by the CEO, the single number that tracks what the ERP investment was for.
04
Active customers by market
Owned by Sales, the leading indicator the lagging revenue numbers follow.
The definitions did the heavy lifting
What counts as a sale was written down once: which document types, at which point in the order-to-invoice flow, in which currency conversion. Credit memos, until then the monthly grenade in the review, got one agreed rule applied identically to every market and every salesperson. A salesperson can accept a number that costs them if the same rule costs everyone equally.
Each definition went into a measure dictionary the owners signed before any screen was designed. The dictionary, not the dashboard, is the asset. The dashboard reads it aloud every month.
The screens came last, under few rules
- One question per screen.
- Every number next to its target, because actual without goal is trivia.
- Trend before snapshot.
- The why one click below, visible when a number moves and invisible when it does not.
- Clutter treated as a cost: a visual adds value or leaves.
Result
The same platform, after agreement
Exhibit B. The after-pattern on the same reporting platform, synthetic data: the four agreed key results with targets are self-evident, the margin miss carried by the hero card, one trend with percent to target, one breakdown.
The dispute shrank to a corner of the session. Sales per salesperson and per market had been the recurring argument, and it receded not because a chart got prettier but because the definition got signed. When the number costs you and you agreed to the rule that produced it, the conversation moves from “that figure is wrong” to “here is what I will do about it.”
Reporting shrank on purpose. The population of standard reports and per-person spreadsheet extracts began retiring, replaced by the small agreed set. Salesperson specifics sit on a second screen and marketing investment rationale on a third, so these numbers stay watched without taking the bulk of the attention in the review.
Standard reports and personal extracts retired
9
Time from a leadership question to a trusted answer
2 days → “in meeting”
Limits
What this case does not prove
The case demonstrates a reporting layer turning an ERP’s records into accountable progress at one company. It does not establish a quantified return on the ERP investment, and it does not claim the pattern’s numbers transfer: targets, definitions and the pace of adoption are specific to every business. The platform itself was never evaluated; the work sat entirely in the layer above it. What transfers is the discipline: agreed definitions, named owners and targets beside actuals.
The three questions before you rebuild the reporting layer
01
Which decisions should the system’s data feed?
Name the reviews and the choices. A number that feeds no decision is inventory for a watchlist.
02
Who answers for each number?
A key result requires accountability. Single-person ownership is what turns it into a commitment.
03
Which definition would Sales and Finance both sign?
If the two would sign different definitions of a sale, the dispute isn’t settled, and a dashboard won’t resolve it by itself.
Does this case look familiar?
In a free 30 to 60 minute orientation call, we discuss your setup and what is worth addressing first.
Full case study
Download the case study
Get the full case as a PDF: the situation, the method, and what to do before building a dashboard.
We use your email to send this case study and to follow up on it. See our Privacy Policy.