Success Case · Fast-Moving Consumer Goods
Can a more responsive forecast improve seasonal planning?
A measured test of the Seasonality-Aware Demand Planning Framework versus fixed planning rules in an anonymized FMCG case study.
Anonymized FMCG evidence note · Results are period-specific
One prior-year rule was asked to cover several demand patterns
The incumbent approach
Heuristic baseline
Prior-year actuals plus a fixed growth percentage applied globally.
Stable origin assumption
Works well when assortments and markets are familiar and static.
Manual correction
Relies heavily on planners to adjust for every seasonal shift.
The scaling reality
Expanding complexity
New products and markets bring diverse demand shapes (Smooth, Erratic, Lumpy).
Moving seasonal targets
Religious dates that move against the standard calendar disrupt prior-year comparisons.
The opportunity
Improve planning accuracy without removing the planner’s essential market knowledge.
The framework separates baseline, seasonal timing and planner input
01
Forecast demand shapes differently
Prioritize key items at SKU level; pool lower-volume items by category and market. Assign methods by demand profile rather than using one rule for all.
02
Separate baseline from seasonal timing
Combine recent level and trend with recurring month patterns and religious dates that move against the standard calendar, calibrated on the business’s own history.
03
Keep business inputs explicit
Planners override for confirmed commercial or supply events missing from sales, then regenerate the six-month forecast and planning range.
Evidence
Different demand profiles require different forecast treatment
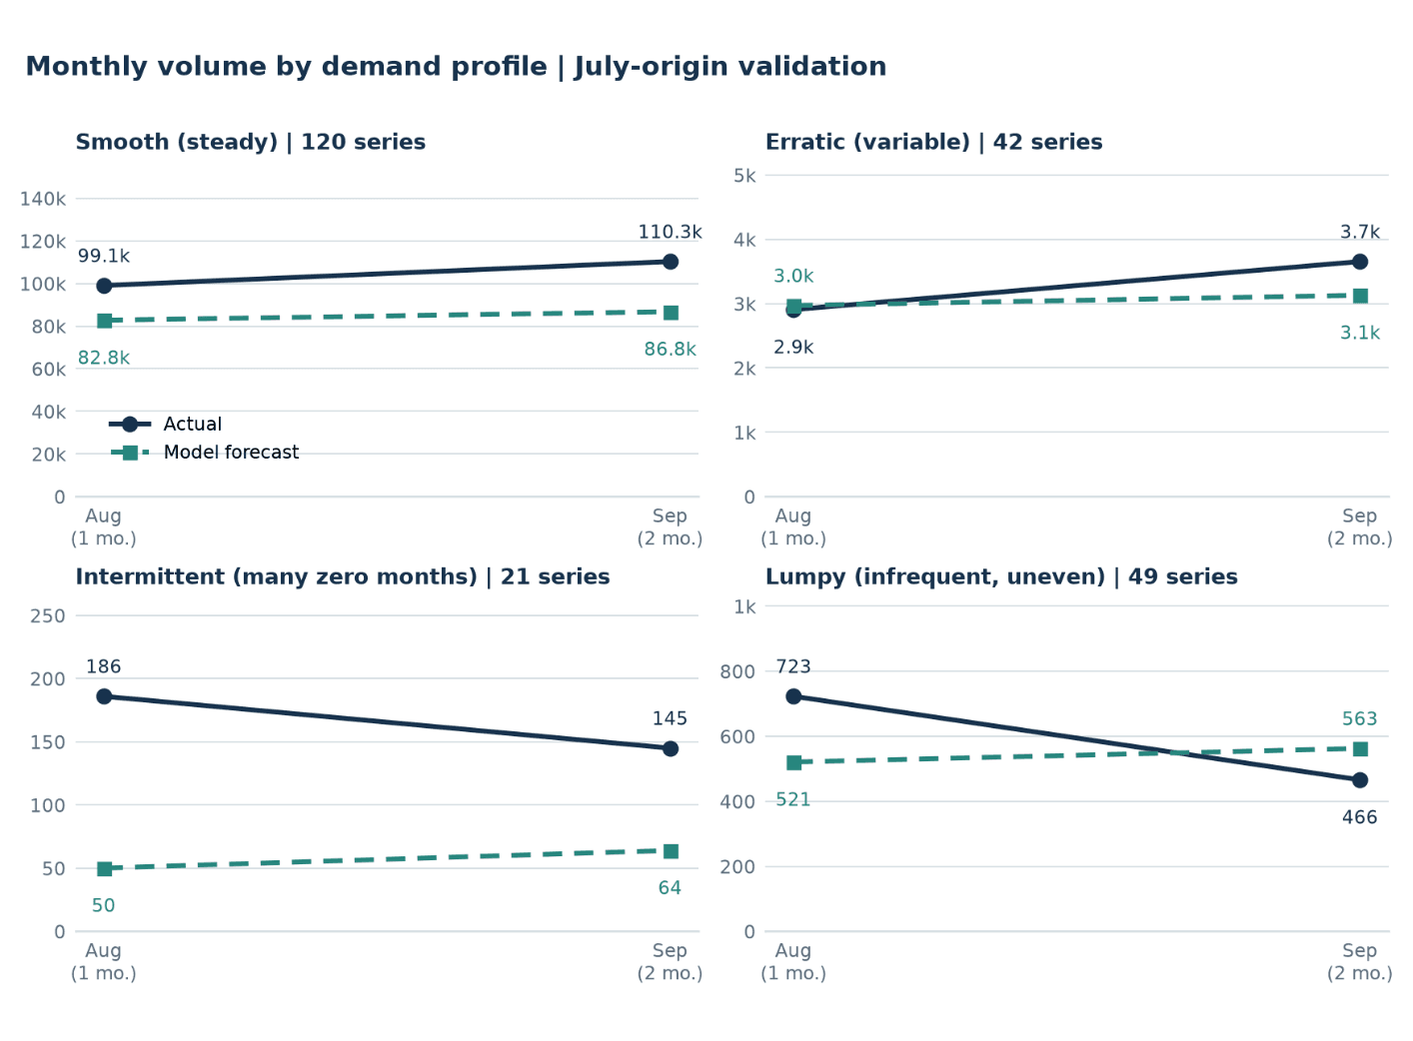
Individual treatment: High-priority items are tracked at SKU level across Smooth, Erratic and Lumpy patterns to capture specific trends.
Validation origin: Results are from the July-origin validation, tracking actuals against forecasts across 1 and 2-month horizons.
Methodological note
A source-workbook CV² defect suppressed Smooth and Intermittent labels. Panels use corrected retrospective labels; aggregate headline remains as-run (Aug–Sep WMAPE: 30.9% vs. 30.5% corrected).
Weighted error was lower than both baselines in all three holdouts
| Forecast origin / actuals | Model WMAPE | Last-year baseline | Existing rule | Model bias |
|---|---|---|---|---|
| July → Aug–Sep | 30.9% | 34.7% | 35.4% | −17.2% |
| August → Sep | 28.1% | 32.6% | 35.6% | −14.3% |
| June → Jul–Sep | 32.8% | 39.6% | 41.8% | +1.4% |
Accuracy advantage held across the frozen window: Pooled across origins, WMAPE at 1, 2 and 3 months ahead was 32.7%, 30.5% and 29.1%, respectively, versus 39.6%, 34.7% and 32.6% for same-month-last-year.
WMAPE = Σ|forecast − actual| ÷ Σ actual. Bias = Σ(forecast − actual) ÷ Σ actual; negative values indicate under-forecast. All values are as-run workbook results; partial October actuals are excluded.
Avg. WMAPE reduction
~18.5%
vs. existing planning rule
A full year of actuals puts the rolling tests in context
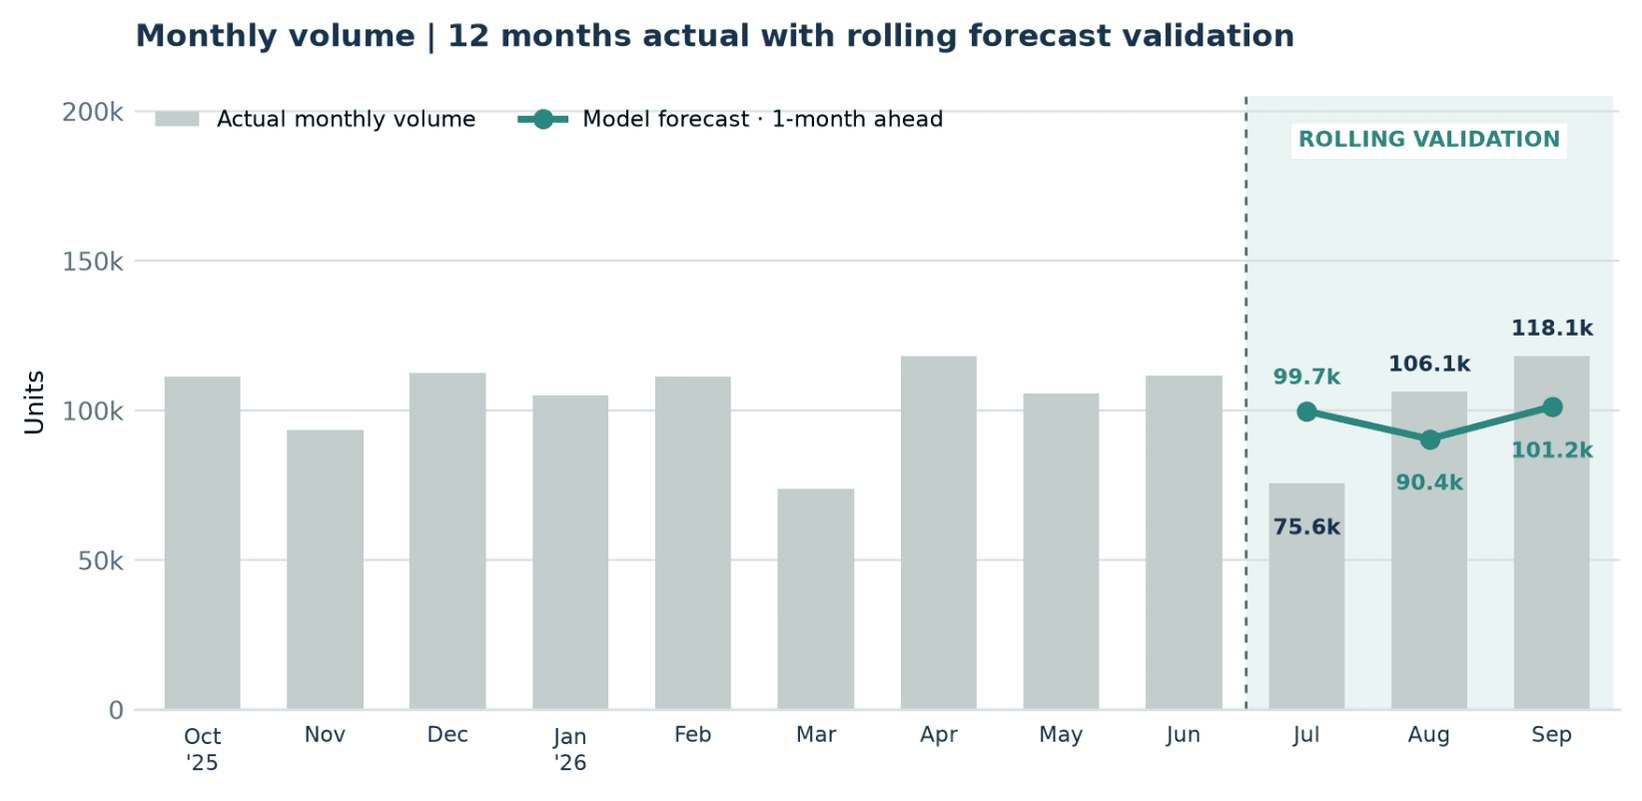
Contextual benchmark: The 12 complete months (Oct 2025 – Sep 2026) are filtered to the same perimeter used in validation to ensure a like-for-like historical comparison.
Teal points show three successive one-month-ahead forecasts overlaid on actuals (origins June-August), not one continuous future forecast. No interval is shown because the workbook does not provide a comparable monthly range for these holdouts.
Outcome
The measured proxy improved and the next step is a disciplined retest
Value-weighted item-month mismatch
€3.5m→€2.7m
~€0.8m (24%) lower in this test
Over-forecast exposure at selling price
€2.0m→€1.4m
~€0.6m reduction in potential exposure
Practical next step
Refine the model without over-engineering, re-run held-out comparisons, and track operational outcomes.
These are rounded selling-price-weighted measures, not realized savings or inventory carrying costs. Holding costs, write-offs, expediting, production-change fees, service impact and cash released were not measured.
Full case study
Download the case study
Get the full evidence: the forecast approach, the validation results and an honest take regarding next steps.
We use your email to send this case study and to follow up on it. See our Privacy Policy.